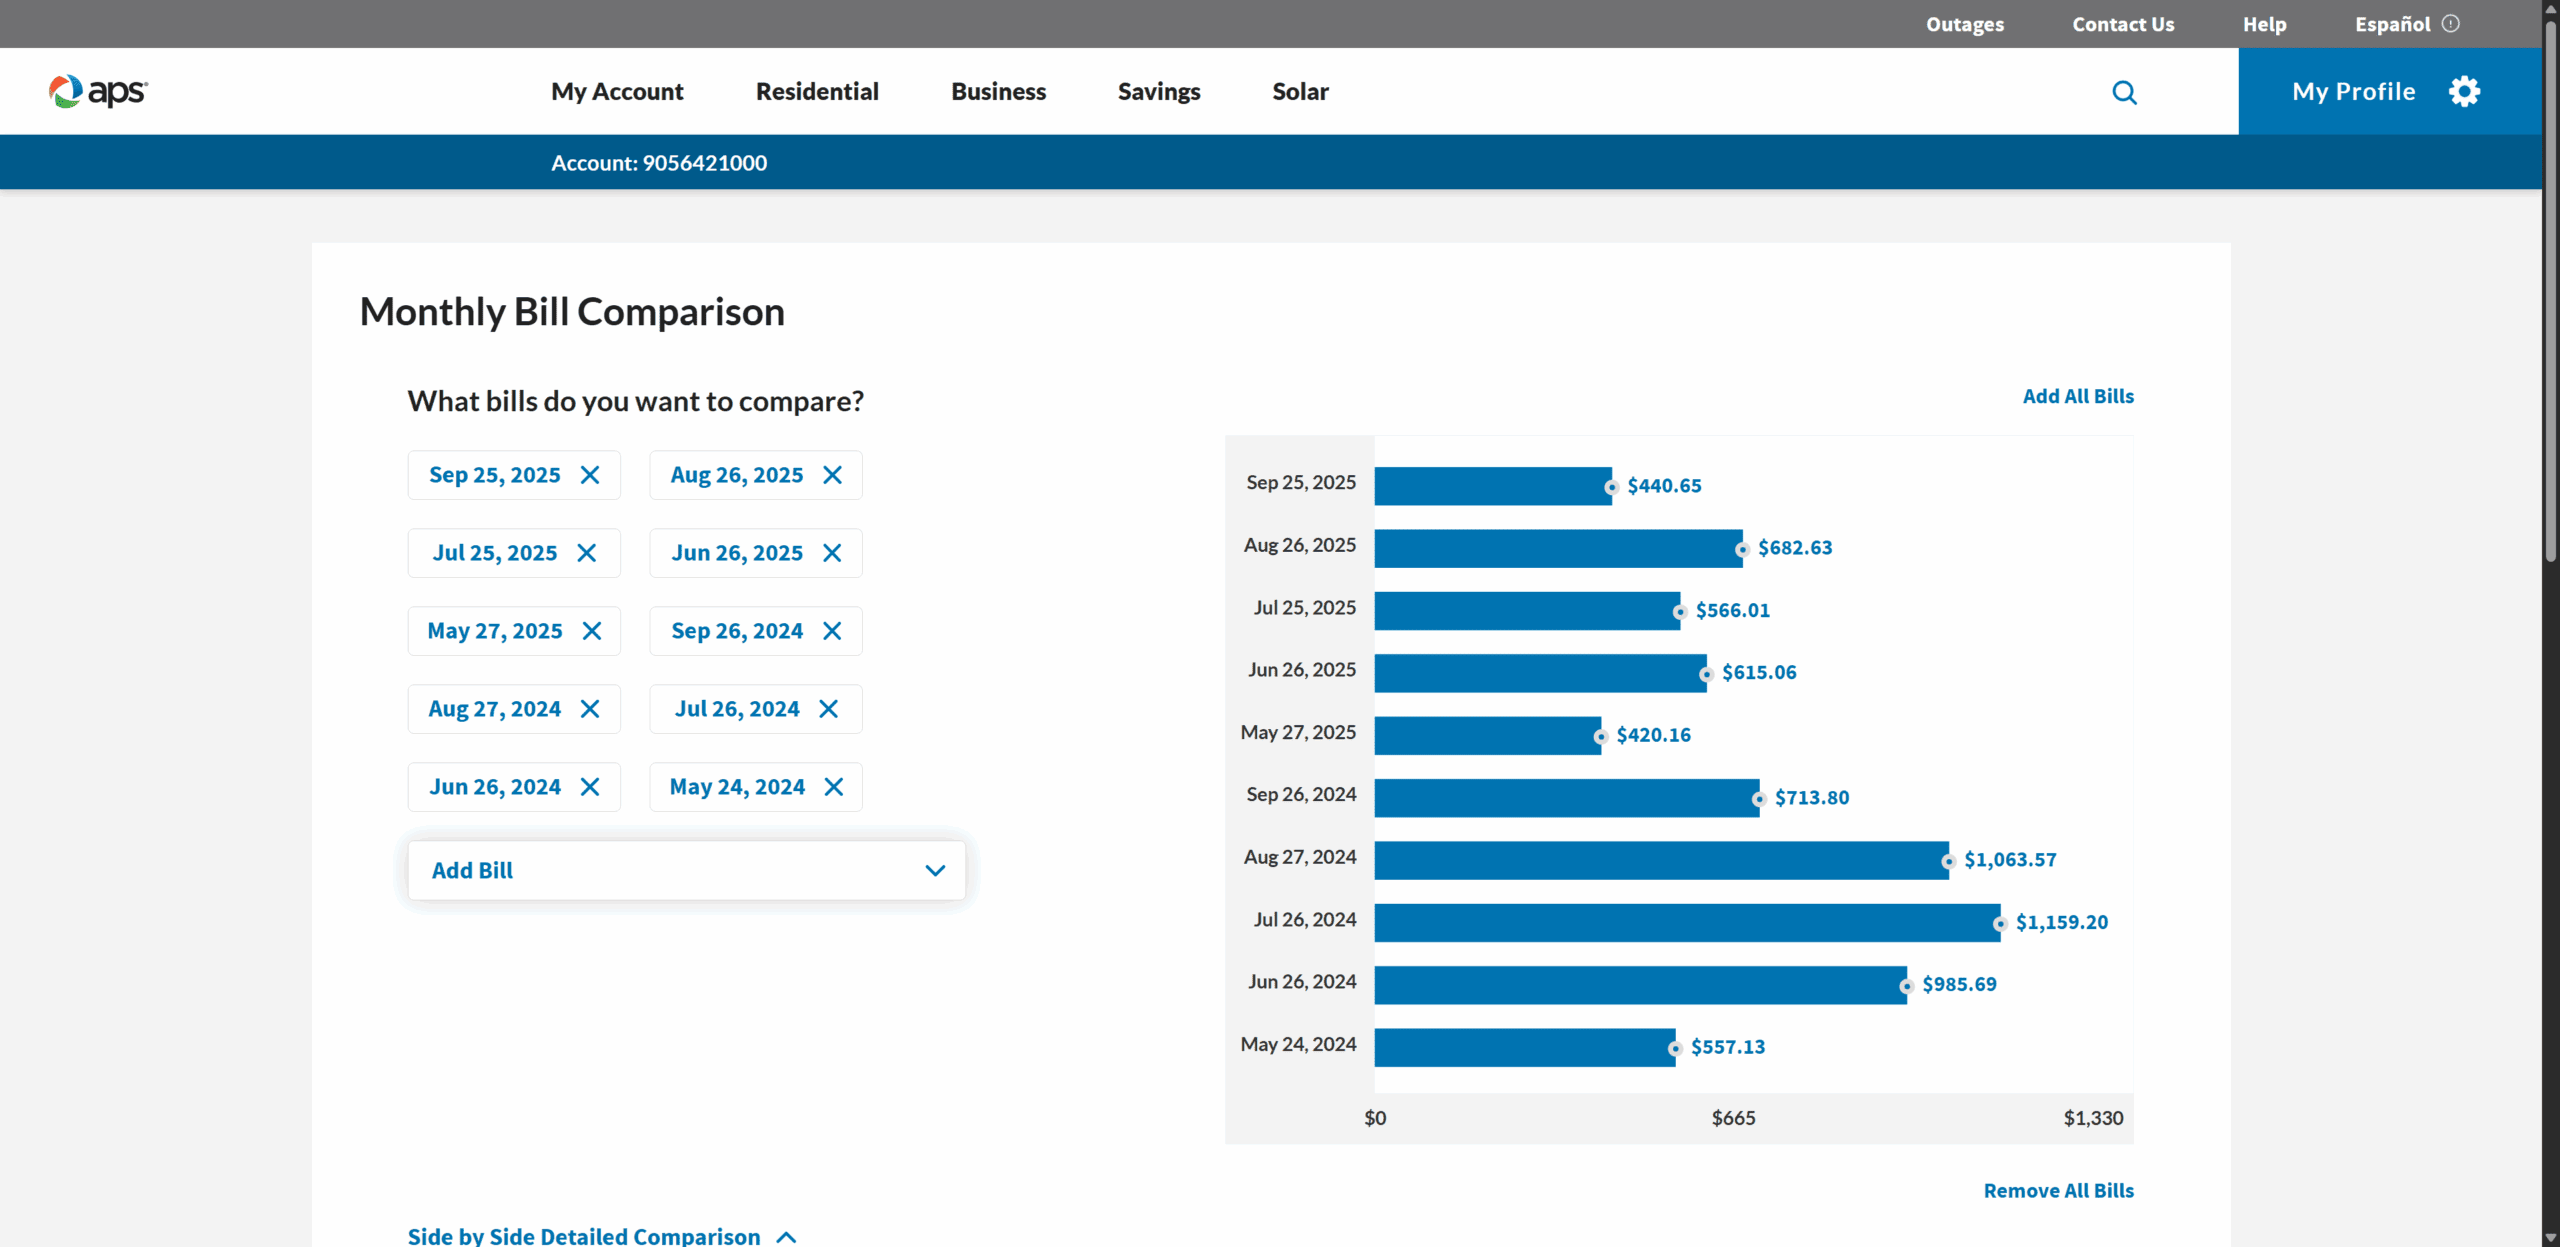
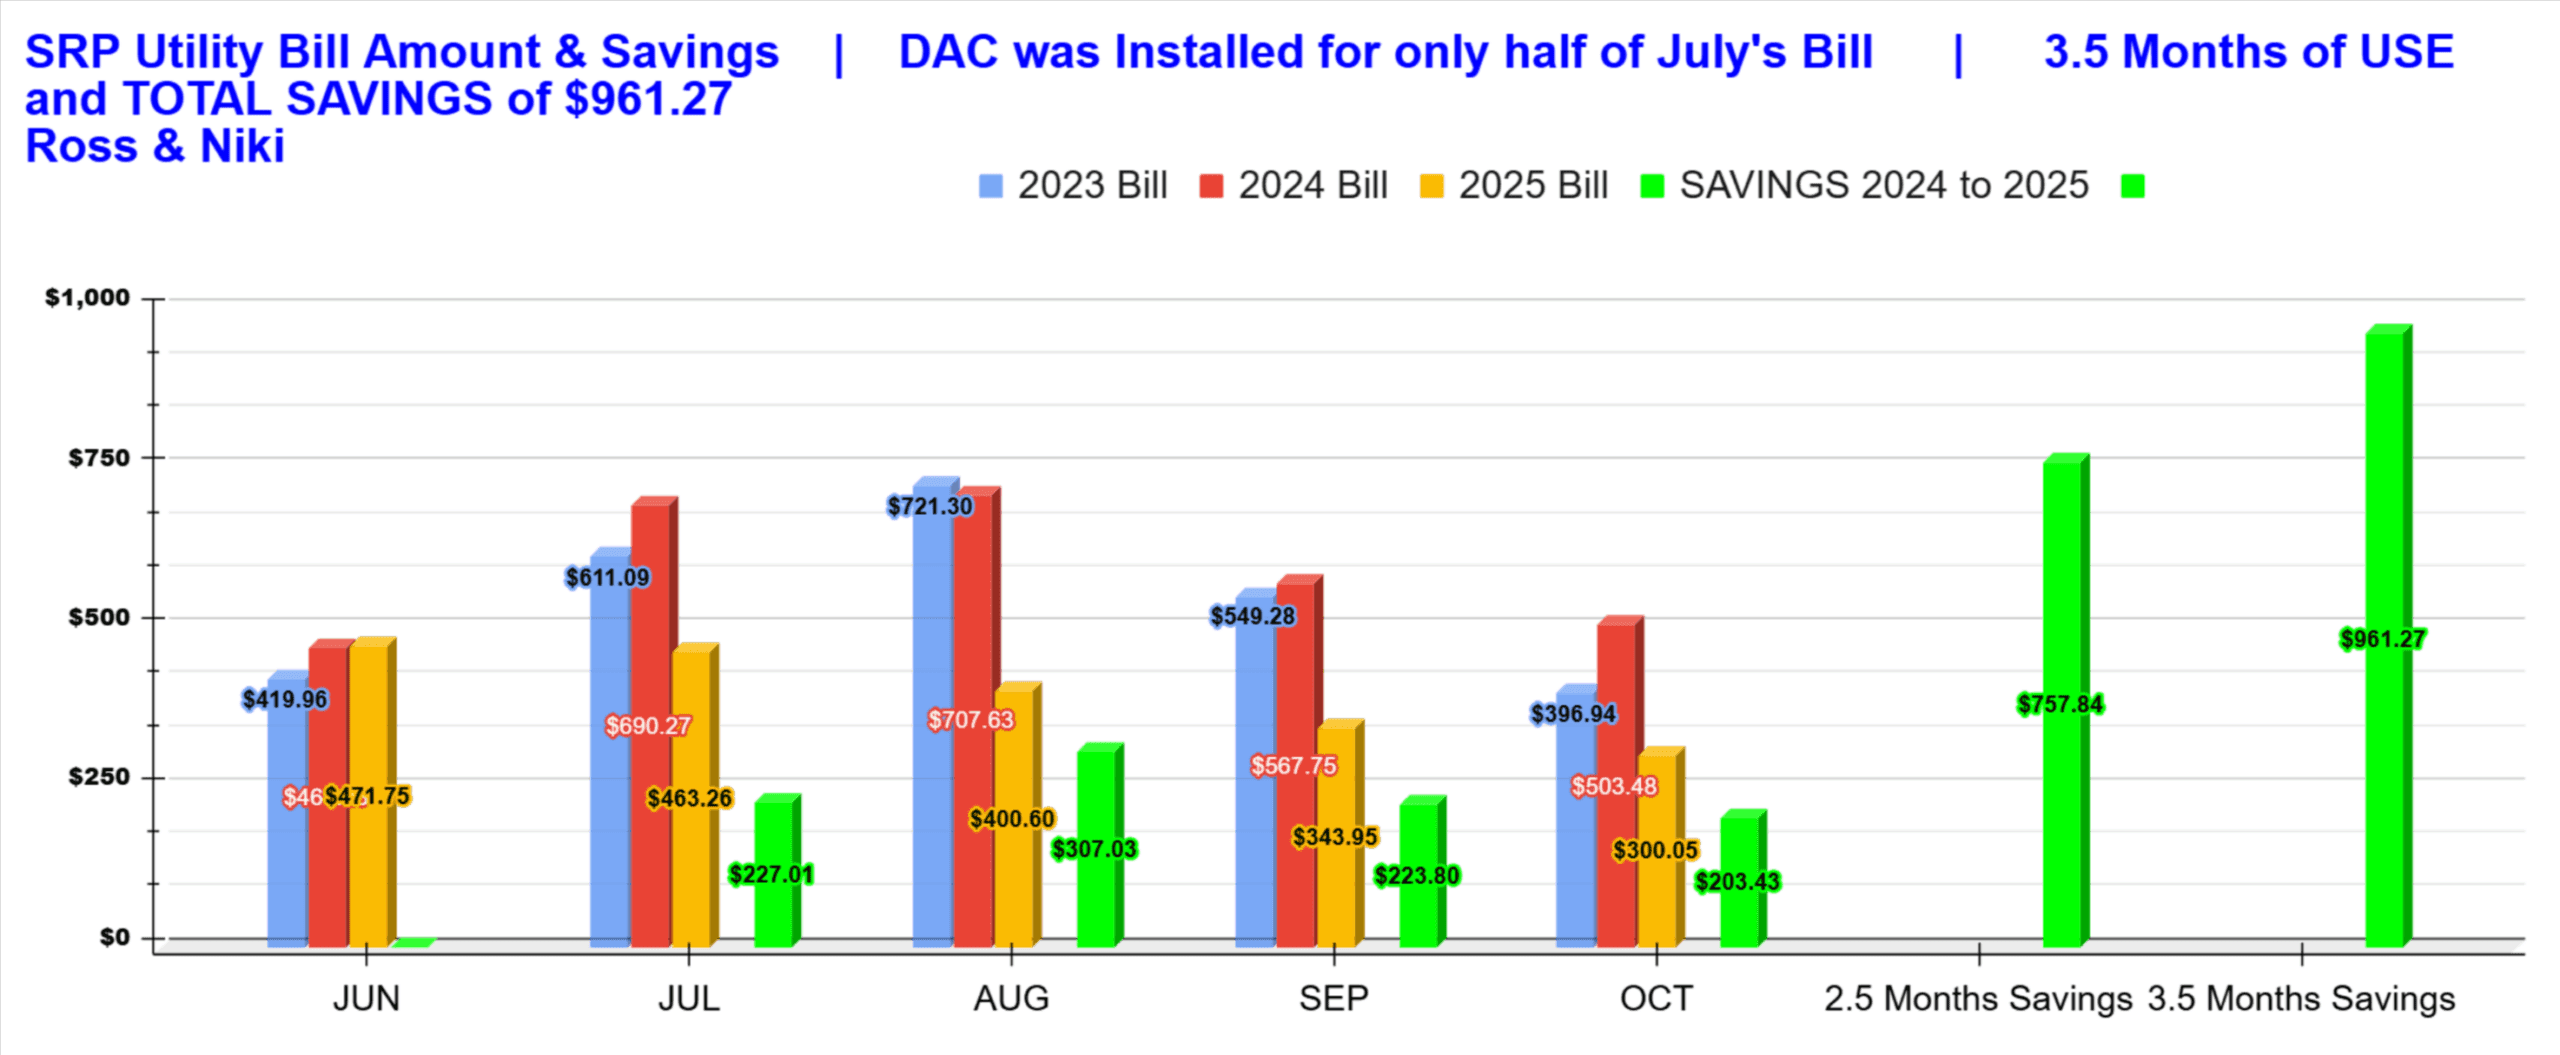
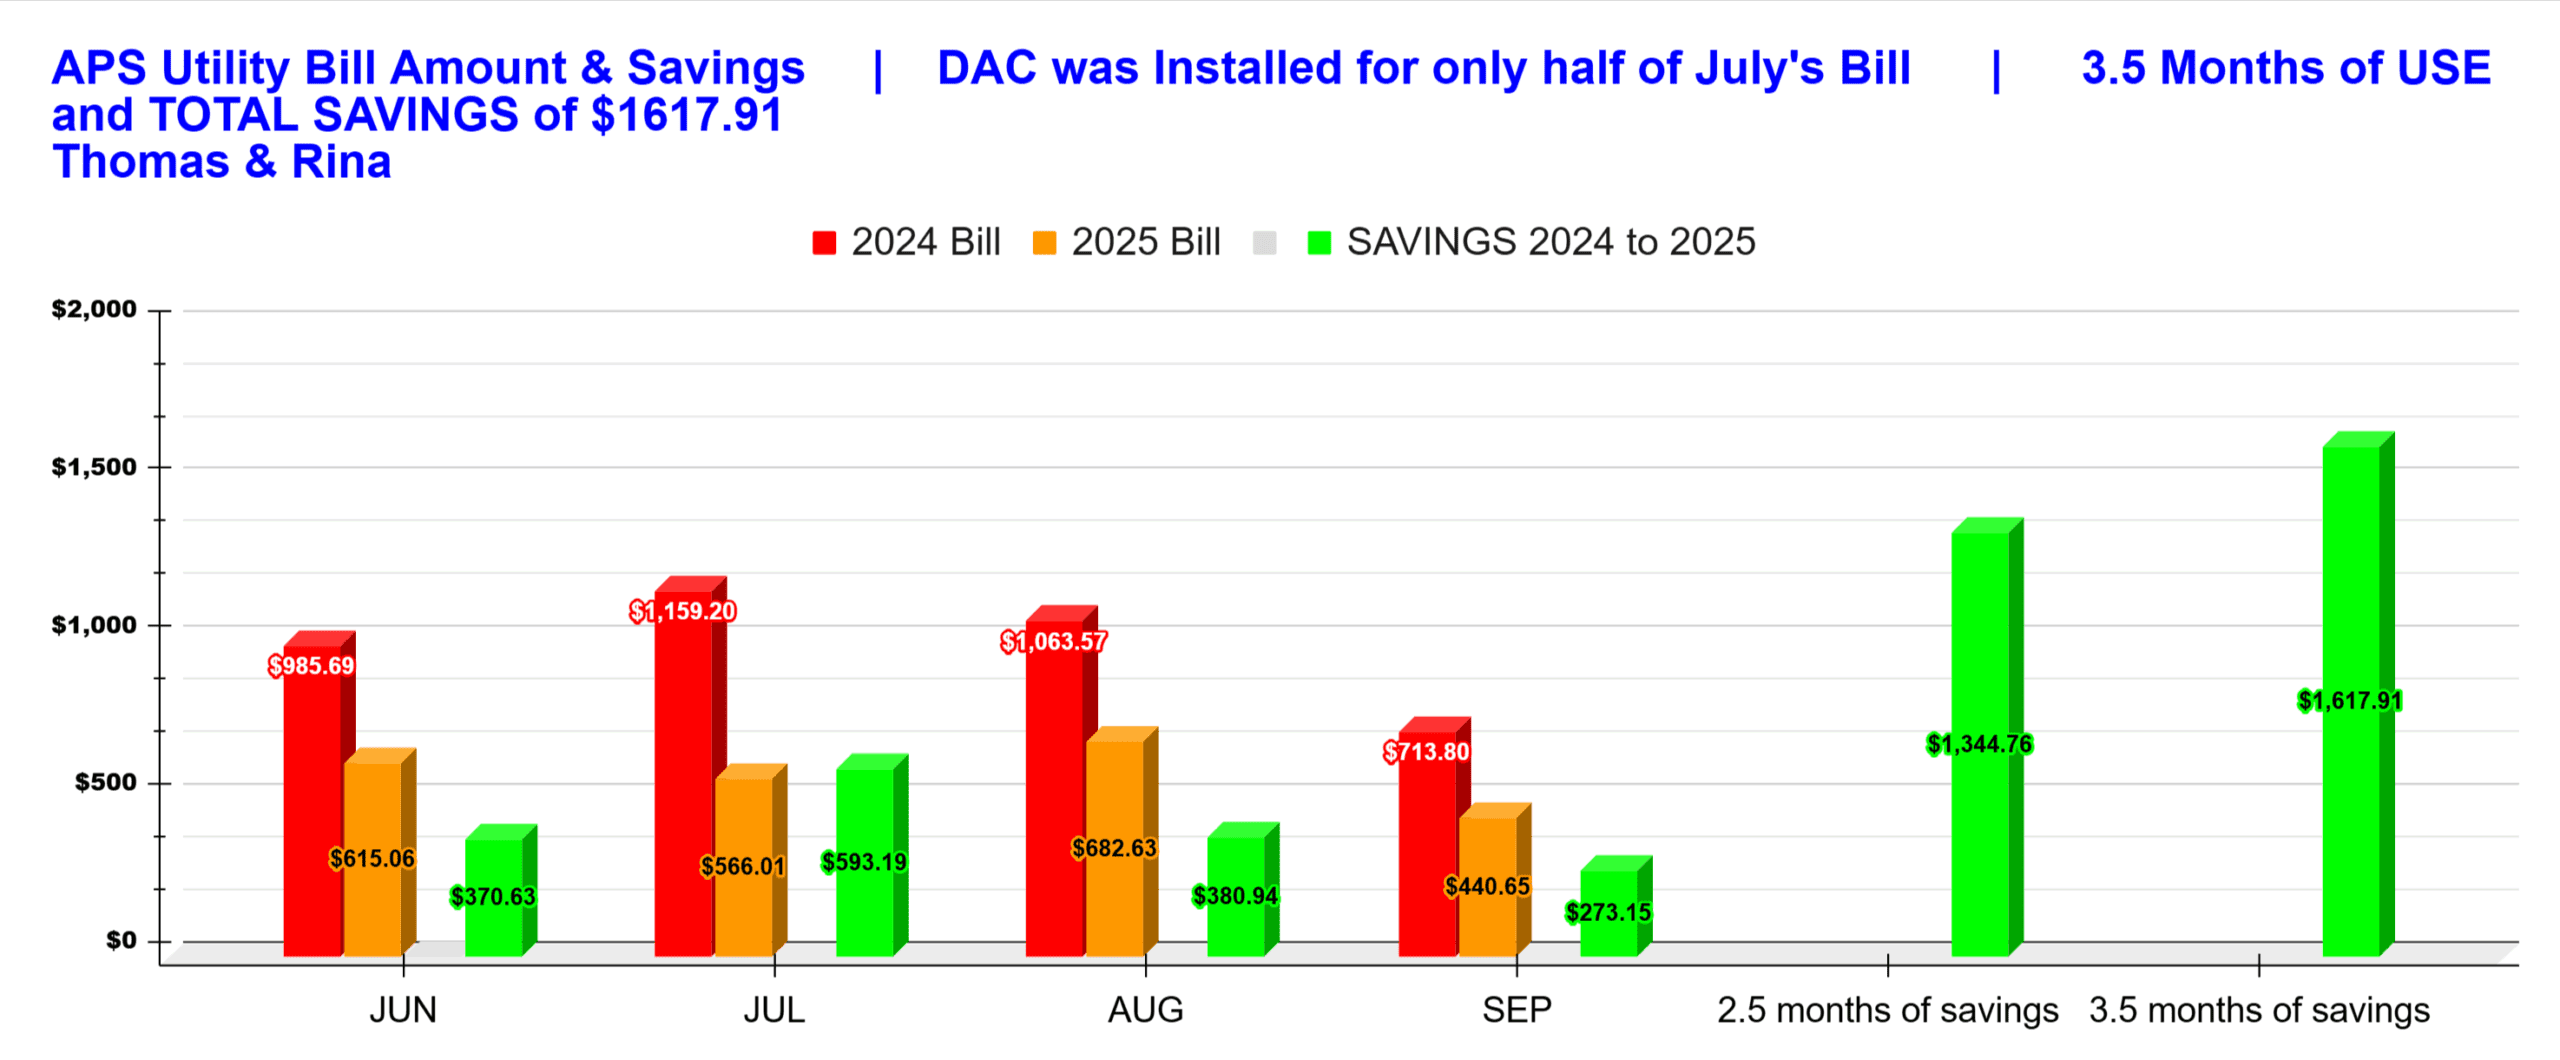
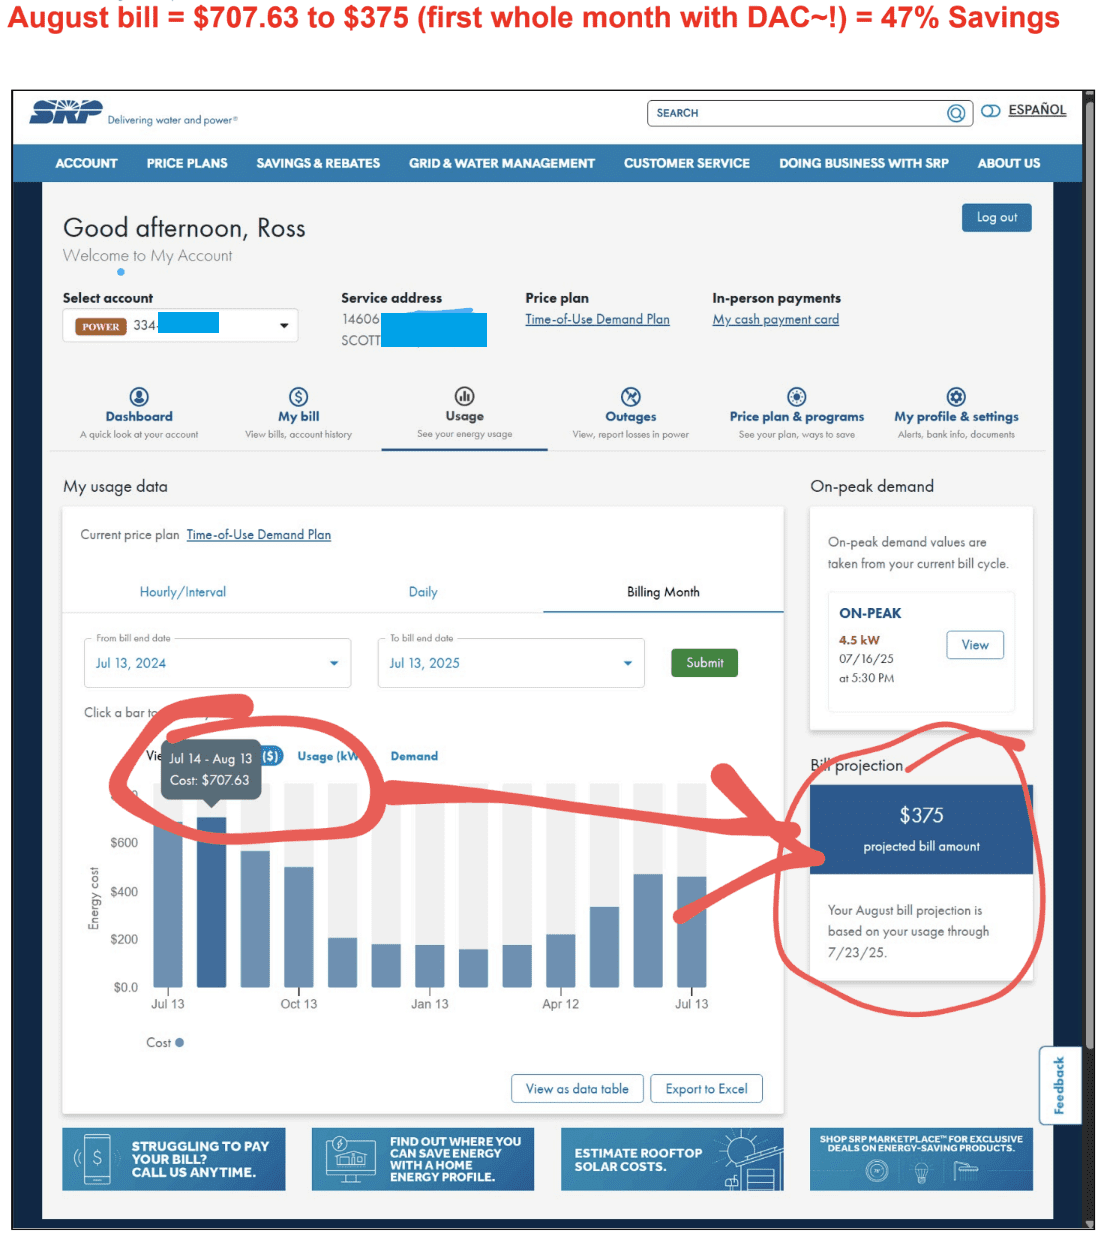
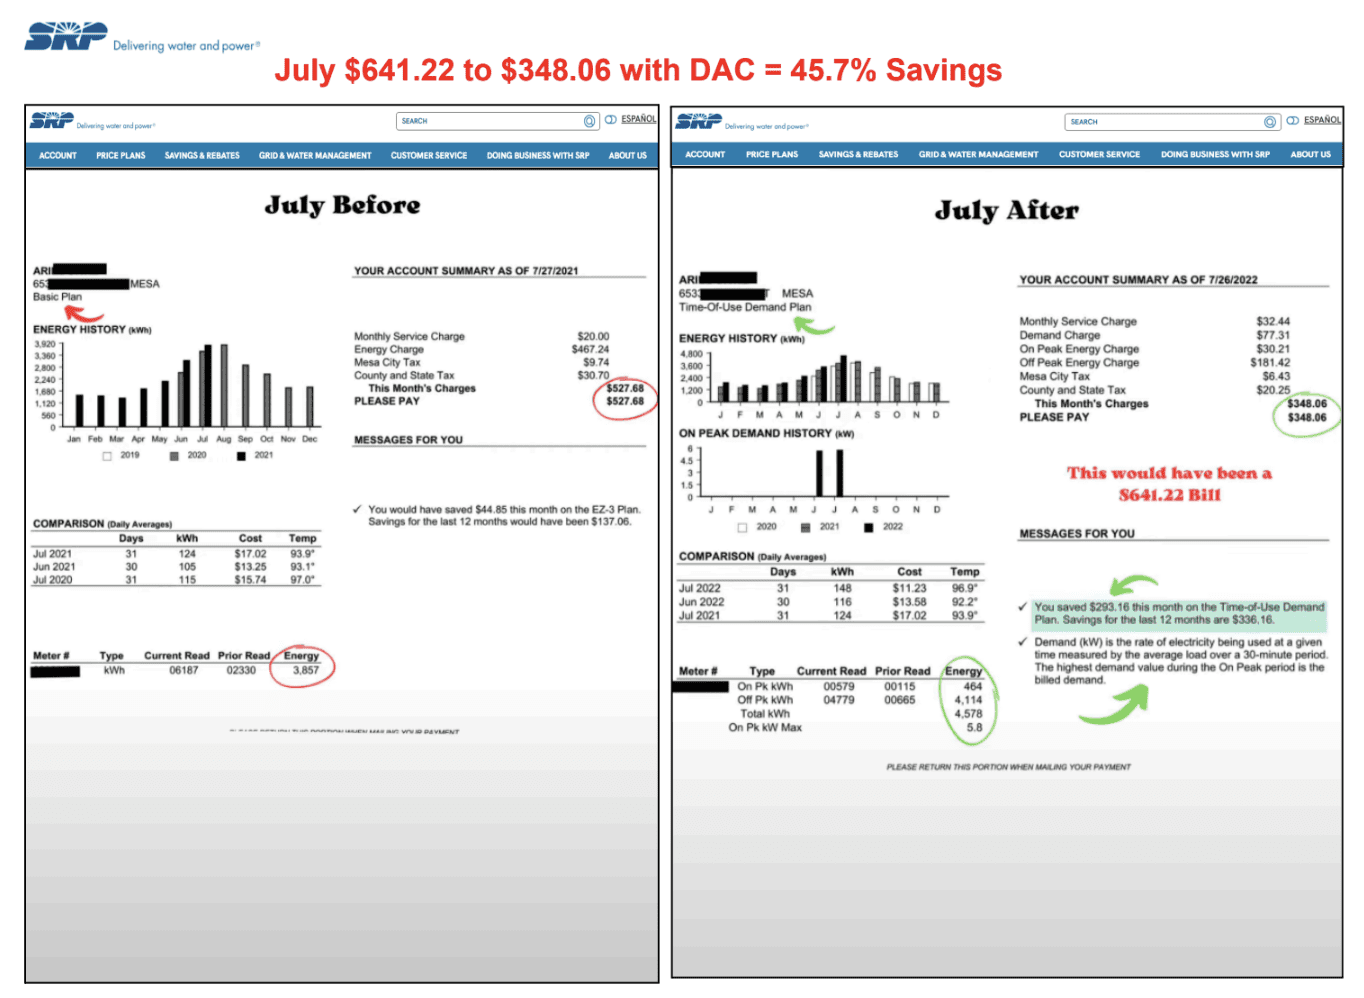
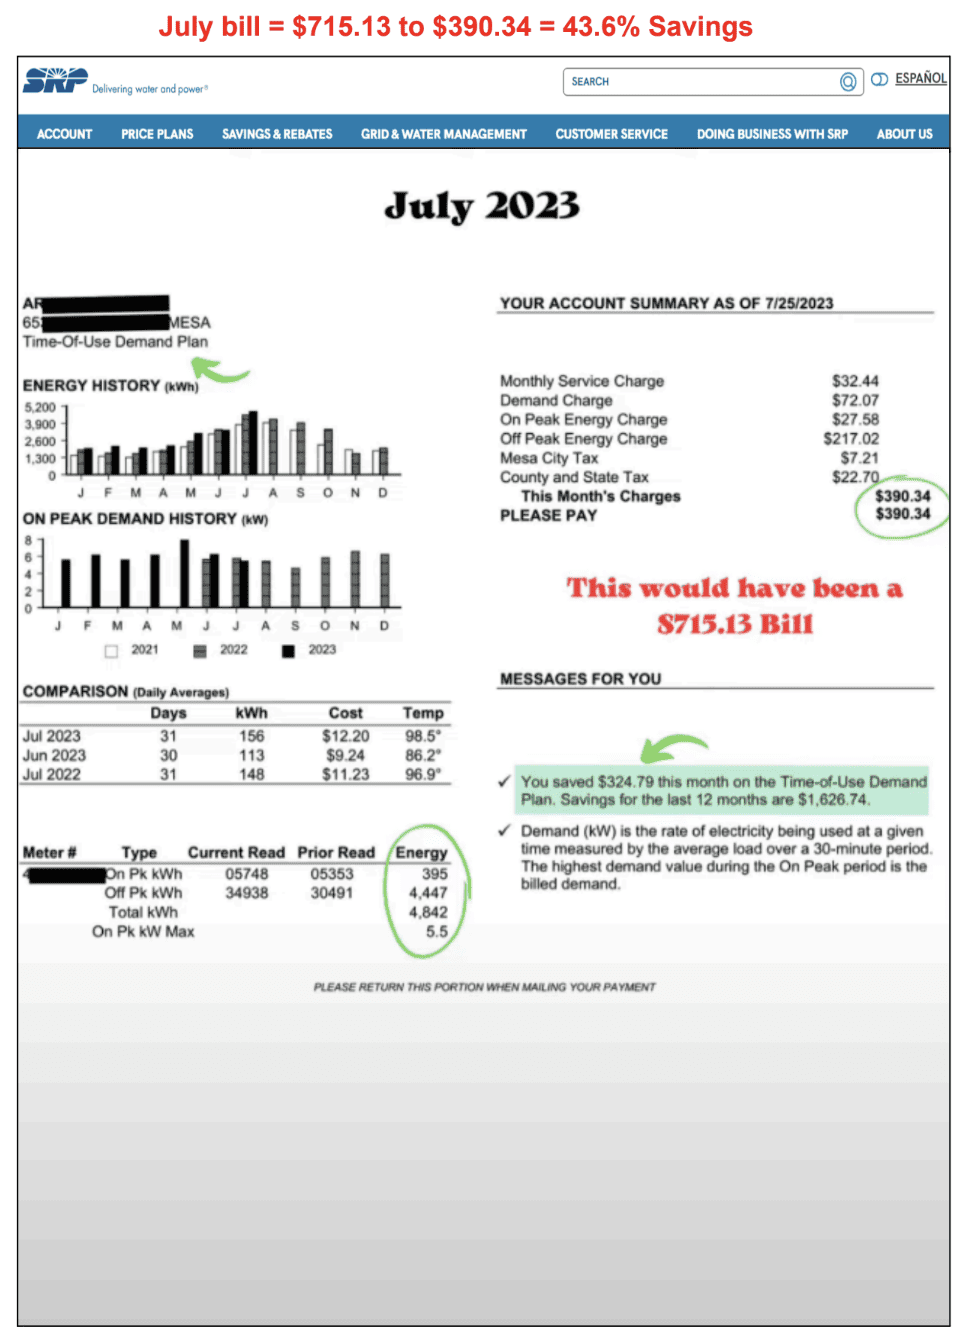
Bills Before and After — Proof You Can Hold in Your Hand
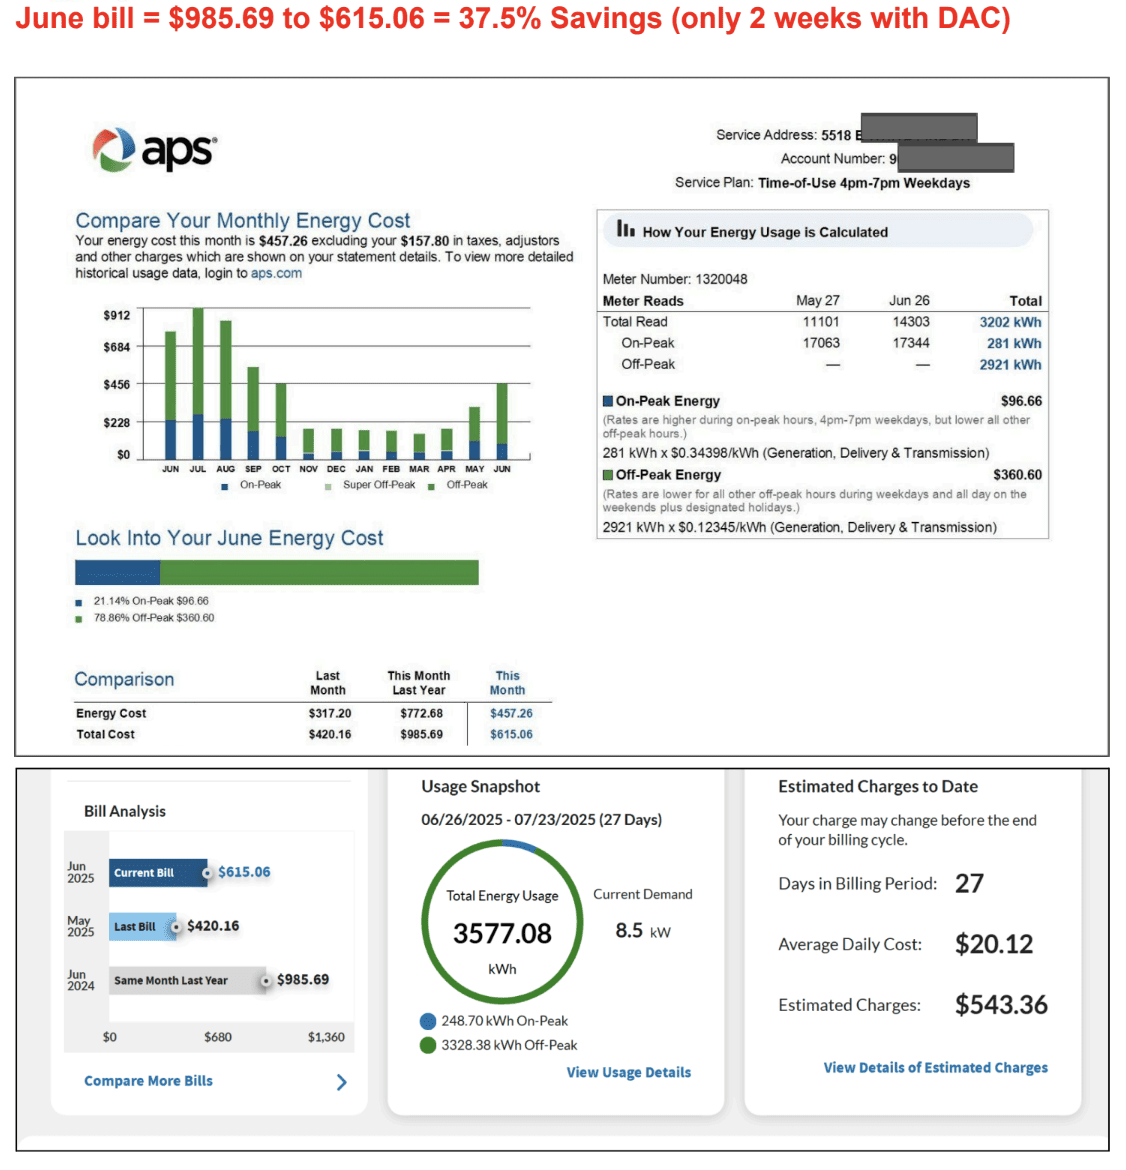
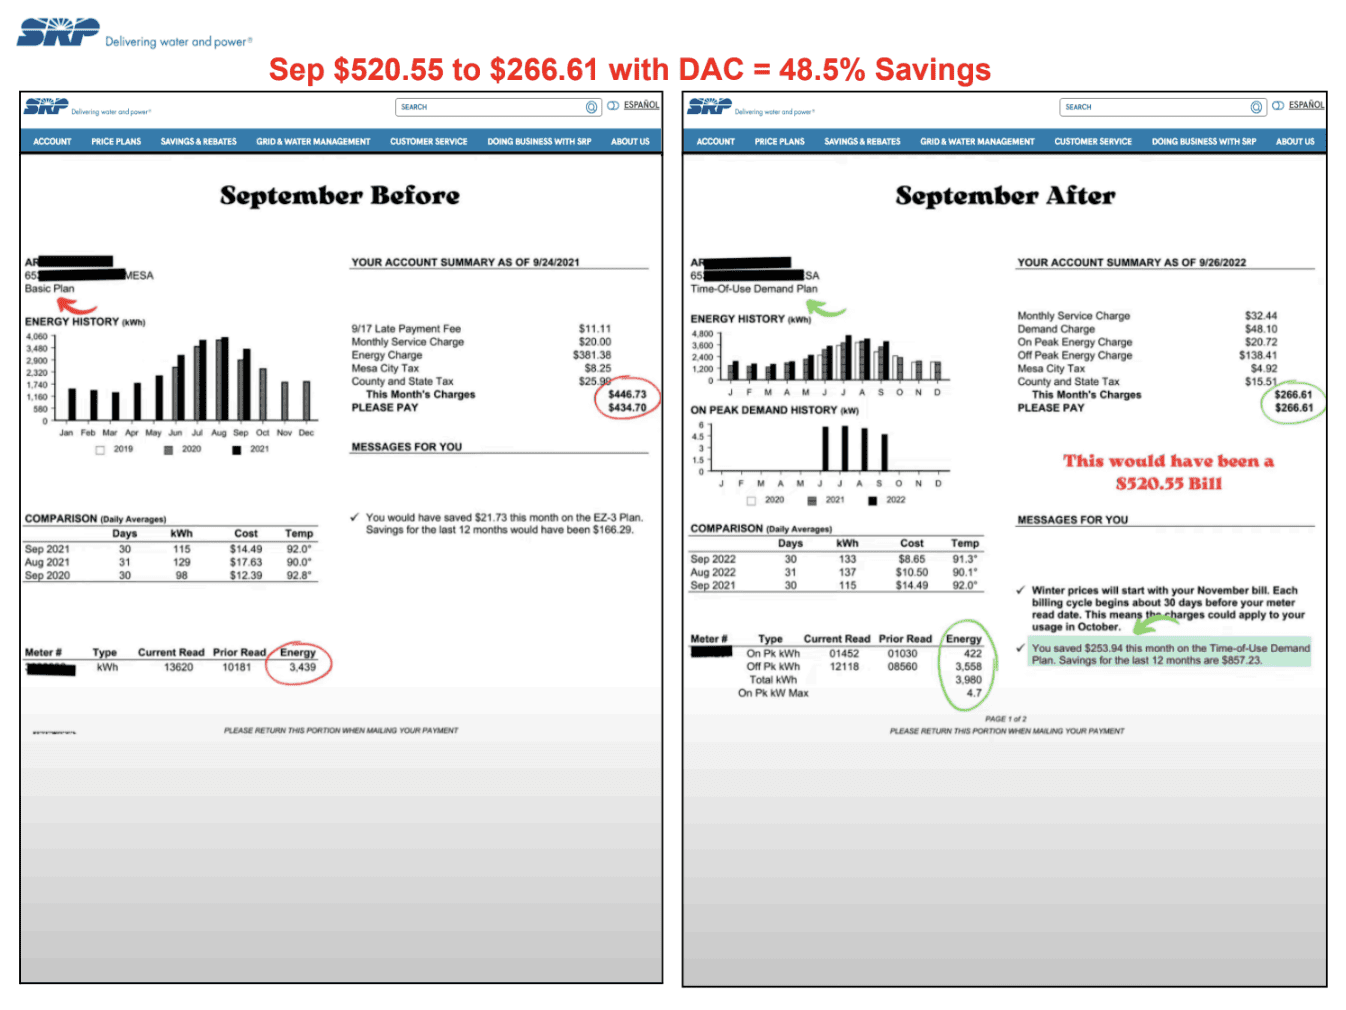
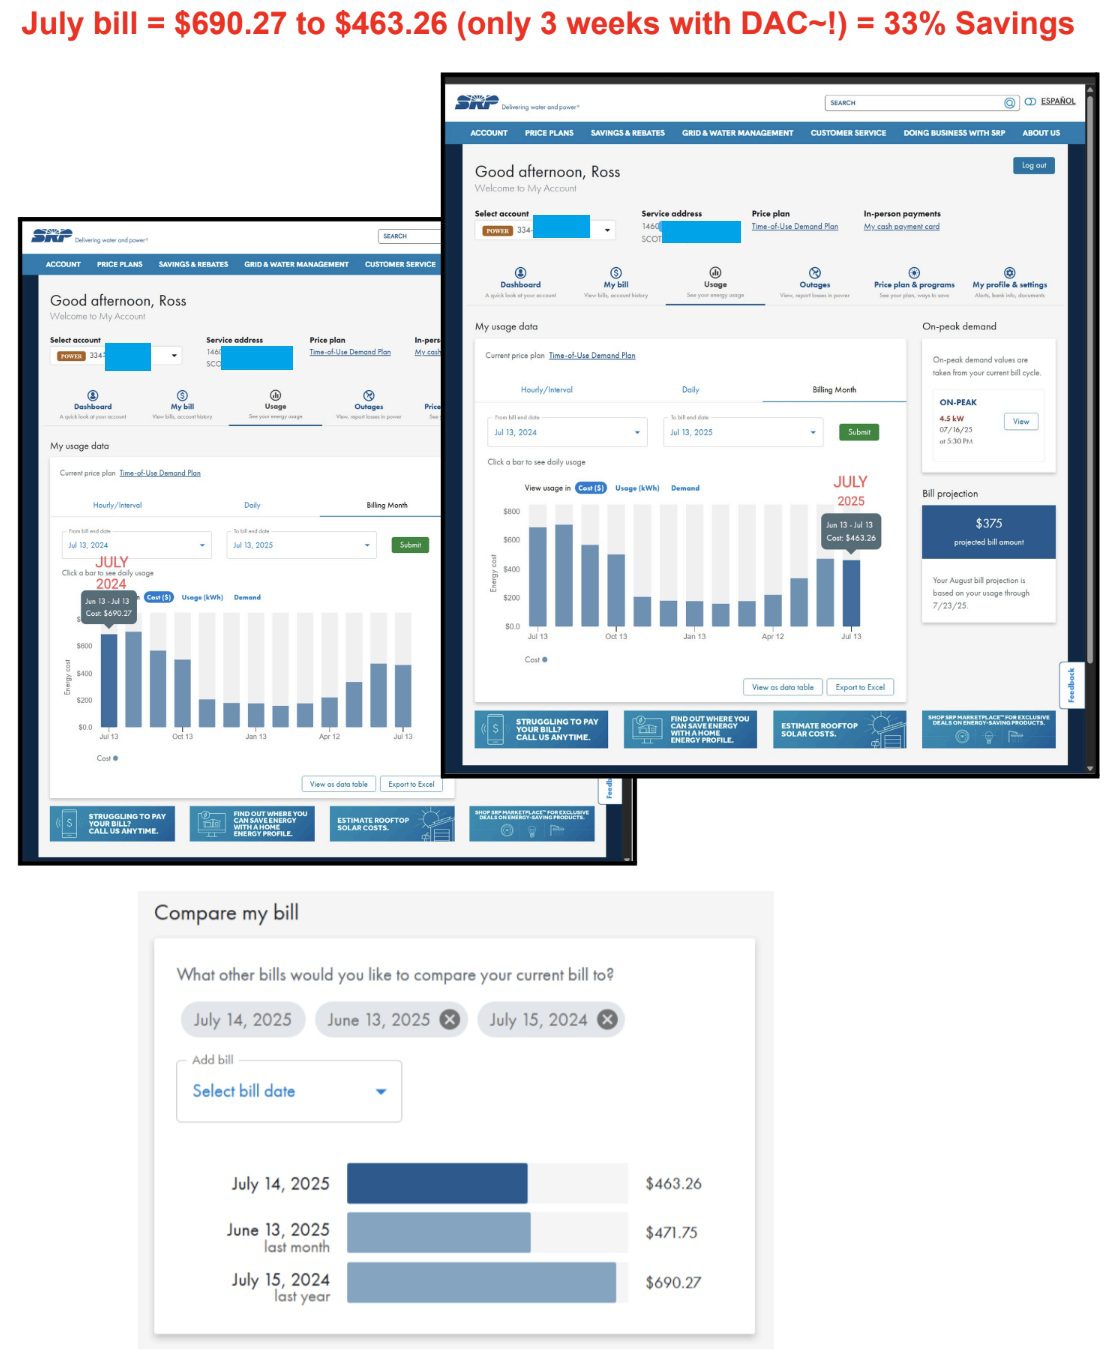
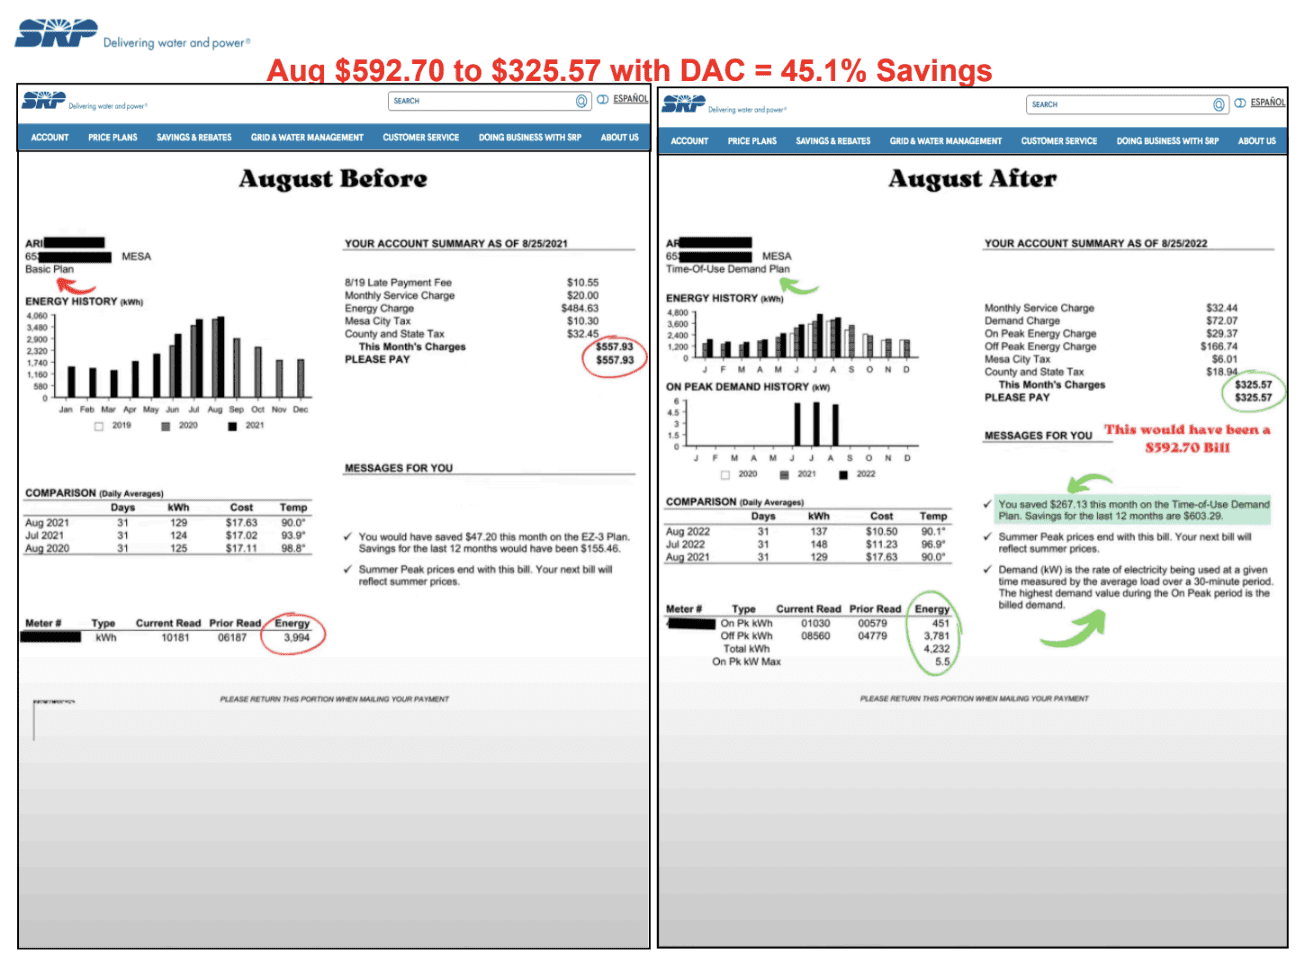
Numbers don’t lie. That’s why we show real bills, real graphs, and real stories from homeowners just like you. With Interactive Energy Systems’s demand automation, families see their monthly statements drop immediately — without changing comfort, routines, or appliances.
What you’ll find here is more than marketing claims. You’ll see side-by-side bills that reveal how much demand charges shrink after automation. You’ll see demand graphs where painful spikes simply disappear, month after month. You’ll find local case studies that match your home size, your utility, and your lifestyle, so you can compare apples to apples. And you’ll hear directly from homeowners in video stories, explaining the shock of their first lower bill and the relief of year-one savings.
The results speak for themselves
Arizona (APS/SRP): 50–60% total-bill reductions are common during peak summer months.
Duke Energy (NC): Homeowners report $150+ in savings each summer month.
Dominion (VA): Demand peaks cut from ~6.8 kW to ~4.0 kW, saving around $125 every month.
Georgia Power: Customers unlock Super Saver rates and cut bills up to ~50%.
Alabama Power: Demand-charge reductions regularly exceed $200/month.
Behind every story is the same truth: unmanaged demand costs far more than it should. With Interactive Energy Systems, your bills stop being unpredictable. They become proof — in black and white — that intelligent automation protects your comfort and your wallet.
Work Process
Our process is designed to be simple, fast, and proven. From the first audit to the moment you see your bill drop, every step is handled by experts who make demand control effortless.